Experiment 7: Integration Grids
The argon dimer, and wiggles that shouldn’t be there
Warm-up
Loading the concept check…
Background
This experiment looks at a subtle issue that can affect the results of any exchange–correlation functional. Kohn–Sham (KS) DFT [1,2] needs a real-space grid to evaluate the exchange–correlation integrals. Most programs build it with an algorithm Becke introduced in 1988 [3]: the integrals become weighted sums over a finite number of points arranged on spheres around each atom. A grid’s “density” is described by its number of radial shells and angular points per shell; (75,302), for example, means 75 radial shells with 302 points each. The choice of grid can change the results significantly, as Wheeler and Houk showed for the M06 family [4,5] and Mardirossian and Head-Gordon for two generations of Minnesota functionals [6,7]. They also point out that meta-GGA functionals usually need finer grids than GGAs.
Choosing the grid is often overlooked, and many practitioners are unaware of the issue. Relying on a program’s defaults is not a good idea, even though some programs pick the grid according to the functional [8]. In this experiment you will study the dissociation curve of the argon dimer. The geometries come from the RG10 subset [9] of the MGCDB84 database [10], with the Ar–Ar distance between 3.0 and 6.0 Å. The interaction energy at each distance is
\[ \Delta E(r) = E\big(\mathrm{Ar}_2(r)\big) - 2\,E(\mathrm{Ar}). \]
| r | ΔE | r | ΔE | r | ΔE |
|---|---|---|---|---|---|
| 3.0 | 2.24 | 4.1 | –0.23 | 5.1 | –0.07 |
| 3.1 | 1.21 | 4.2 | –0.21 | 5.2 | –0.06 |
| 3.2 | 0.57 | 4.3 | –0.18 | 5.3 | –0.05 |
| 3.3 | 0.18 | 4.4 | –0.16 | 5.4 | –0.05 |
| 3.4 | –0.06 | 4.5 | –0.14 | 5.5 | –0.04 |
| 3.5 | –0.19 | 4.6 | –0.13 | 5.6 | –0.04 |
| 3.6 | –0.26 | 4.7 | –0.11 | 5.7 | –0.03 |
| 3.7 | –0.28 | 4.8 | –0.10 | 5.8 | –0.03 |
| 3.8 | –0.28 | 4.9 | –0.09 | 5.9 | –0.03 |
| 3.9 | –0.27 | 5.0 | –0.08 | 6.0 | –0.02 |
| 4.0 | –0.25 |
Use the functionals B3LYP [11–15], M06-L [16], M11 [17], M11-L [18] and ωB97M-V [19,20], and feel free to add others. Use the def2-TZVP basis set [21] for all calculations, and try the grids SG-1, SG-2 and SG-3 (Q-Chem keyword XC_GRID = 1, 2 or 3).
Present your results as a dissociation curve like the one in Figure 1, which shows the VSXC functional [22,23]. Before plotting, collect the data in a table like Table 2.
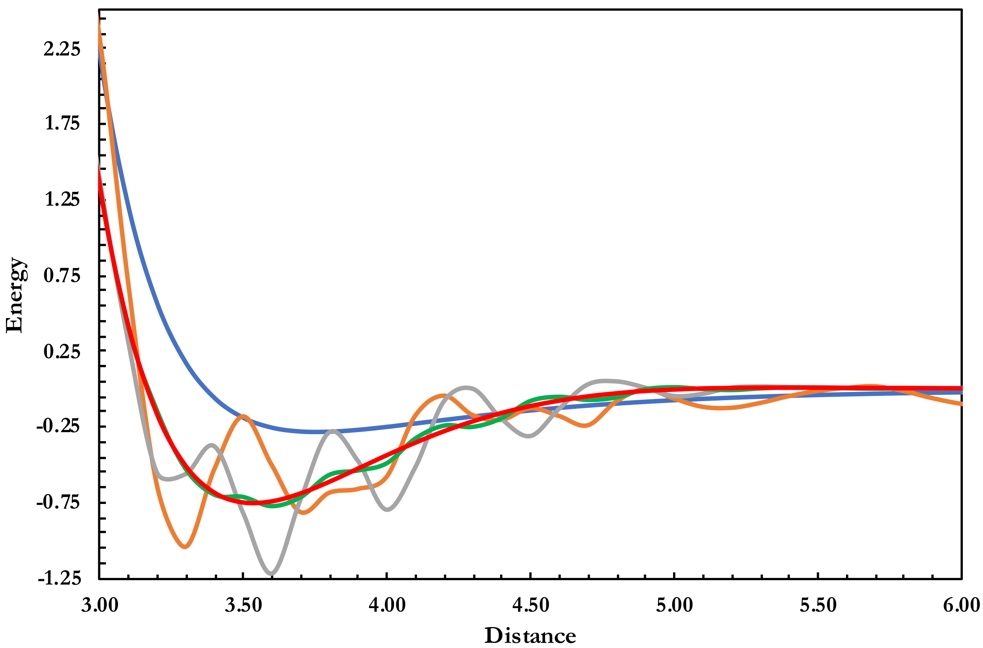
| r | ΔE | r | ΔE | r | ΔE |
|---|---|---|---|---|---|
| 3.0 | 2.33 | 4.1 | –0.18 | 5.2 | –0.12 |
| 3.1 | 0.71 | 4.2 | –0.04 | 5.3 | –0.09 |
| 3.2 | –0.63 | 4.3 | –0.17 | 5.4 | –0.05 |
| 3.3 | –1.04 | 4.4 | –0.20 | 5.5 | –0.01 |
| 3.4 | –0.53 | 4.5 | –0.13 | 5.6 | 0.01 |
| 3.5 | –0.18 | 4.6 | –0.18 | 5.7 | 0.02 |
| 3.6 | –0.50 | 4.7 | –0.24 | 5.8 | –0.01 |
| 3.7 | –0.81 | 4.8 | –0.08 | 5.9 | –0.06 |
| 3.8 | –0.69 | 4.9 | 0.00 | 6.0 | –0.10 |
| 3.9 | –0.66 | 5.0 | –0.06 | ||
| 4.0 | –0.58 | 5.1 | –0.12 |
What a grid looks like
Loading the grid explorer…
The molecules
Loading the molecules…
Predict first
Loading…
Run the calculations
This is the largest set of jobs of the course (5 functionals × 3 grids × 32 structures). SG-1 jobs take seconds, but the finer grids cost much more: expect a few minutes per job with SG-2 and SG-3. Work one functional and one grid at a time, and check the first curve before running the rest. Your instructor may split the functionals across the class.
Loading the job list…
Collect your results with a script
Reading 480 output files by hand is slow, and it’s easy to make mistakes. A small Python script does it for you: ⬇ extract_ex07.py. The same file works on macOS, Windows and Linux.
It reads every Q-Chem output file in a folder, including subfolders. It identifies each job from what Q-Chem echoed in the output (functional, XC_GRID, basis set and Ar–Ar distance), so your file names don’t matter. From each output it takes the total energy, the number of SCF cycles and the wall time, and writes them all to ex07_results.csv in the same folder. It only reads your outputs and never changes them.
Before you start: put all your Experiment 7 output files in one folder. Subfolders, such as one per grid, are fine.
Open Terminal (⌘-Space, type Terminal, Return).
Type
python3 --versionand press Return.- If you see
Python 3.8or newer, you’re ready. - If a window offers to install the command line developer tools, click Install, wait a few minutes, then try again.
- If you see
Type
python3followed by a space. Dragextract_ex07.pyfrom Finder into the Terminal window, type another space, then drag your outputs folder into the window. The line now looks like this:python3 /Users/you/Downloads/extract_ex07.py /Users/you/Documents/Ex7\ outputsPress Return.
If you don’t have Python, install it from python.org/downloads. On the first screen of the installer, tick “Add python.exe to PATH”.
Open PowerShell (Start menu, type PowerShell, Enter).
Type
py --versionand press Enter. You should seePython 3.8or newer. If PowerShell sayspyis not recognized, usepythoninstead ofpyin the next step.Type
pyfollowed by a space. Dragextract_ex07.pyfrom File Explorer into the window, type another space, then drag your outputs folder into the window. The line now looks like this:py C:\Users\you\Downloads\extract_ex07.py "C:\Users\you\Documents\Ex7 outputs"Press Enter.
Shortcut: if Python came from python.org, you can also double-click extract_ex07.py. A window opens and asks for the folder. Drag the folder into it and press Enter.
If you can’t install Python on your computer, use Google Colab in the browser:
Zip your outputs folder (right-click → Compress on a Mac, Send to → Compressed (zipped) folder on Windows).
Open colab.research.google.com, create a new notebook, and upload the zip and
extract_ex07.pywith the folder icon on the left.Run this in a cell. Replace
outputs.zipwith your zip’s name.!unzip -q outputs.zip -d outputs !python extract_ex07.py outputsDownload
outputs/ex07_results.csvfrom the file panel (right-click → Download).
Read the report: don’t skip this step
The script prints a table with the number of usable jobs for each functional and grid. You need 32 in every cell, 480 in total. Then it lists:
- Missing jobs: run them.
- Problems: jobs that crashed or hit the 10-minute limit, SCF cycles that didn’t converge, a wrong basis set, or a missing
XC_GRID(Q-Chem’s default grid depends on the version and the functional, so it doesn’t count as SG-1, SG-2 or SG-3). The script does not take any energy from these files. Fix the input, rerun the job, and run the script again. - Jobs found more than once: the script uses the most recent good run. If it says the energies differ, find out why before you trust either one.
- Not recognized: other Q-Chem outputs in the folder (for example from another experiment). These are ignored.
You can run the script as often as you like. Each run rereads every output and rewrites the CSV.
- Check its work. Open two or three output files, say one per grid, and compare the total energy, SCF cycles and wall time with the table below (Guide 3 shows where to find them). The script is a tool; the numbers you submit are your responsibility.
- Don’t edit the CSV and save it from Excel. Depending on your settings, Excel can round the energies or change commas into semicolons. You can look at it in Excel, but close it without saving, and import the file exactly as the script wrote it.
- Keep your output files. The CSV is a summary, not a replacement for them.
Enter your results
Record the total energy, SCF cycles and wall time of every job. The quickest way is ⬆ Import CSV below: choose ex07_results.csv and all three tabs fill in at once. If any cell already holds a different number, the page asks before replacing it. You can also type the values, or paste a column copied from a spreadsheet. The page computes all interaction energies ΔE(r) = E(Ar₂) − 2 E(Ar) for you and draws the curves as soon as one is complete.
Loading the results table…
Explore your data
The dashed black line is the reference curve. Wiggles that the reference doesn’t have are grid noise, not chemistry.
Loading…
Questions
Loading the questions…
Submit
Loading…